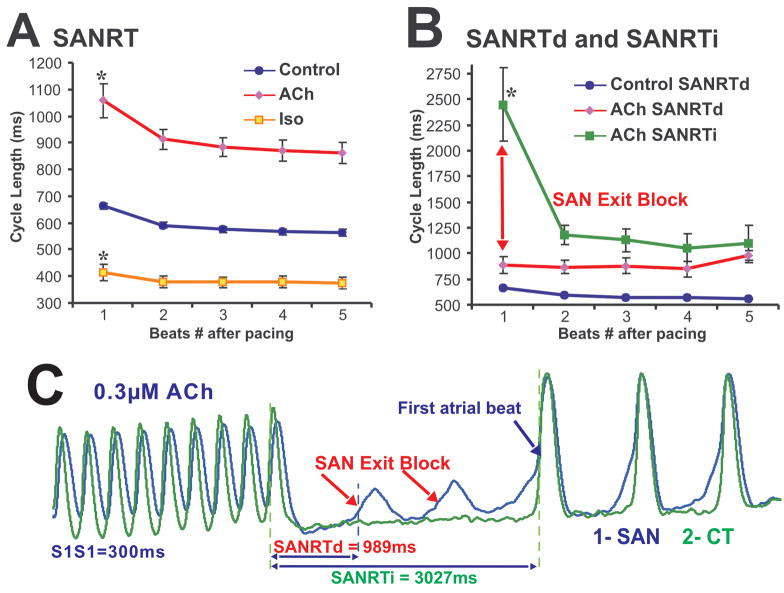
Figure 5. SAN recovery time in control and after ACh and Iso perfusion.
Panels A – SANRT during control conditions and during perfusion with ACh and Iso.
Panel B - SANRTd (direct) and SANRTi (indirect) for pacing-induced SAN exit block cases during perfusion with ACh.
Panel C – An example of SANRTd and SANRTi measurements taken during an episode of exit block, which occurred during perfusion with ACh. SAN OAP shown was selected from the center of the SAN while the atrial OAP was selected from the CT.

