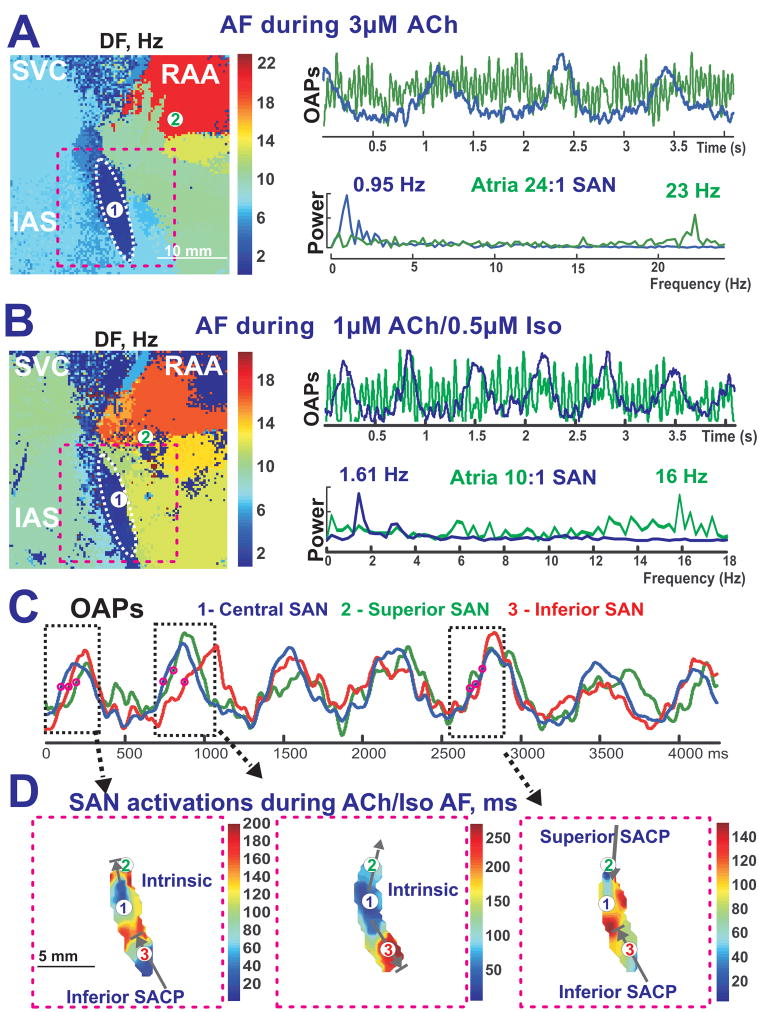
Figure 7. The complex interaction between reentrant atrial waves and SAN intrinsic activity during sustained ACh-induced AF and ACh/Iso-induced AF.
Panels A and B – The complicated interaction between the atria and the SAN during sustained ACh (3 μM)-induced AF (Panel A) and sustained ACh (1 μM) and Iso (0.5 μM)-induced AF (Panel B) (same preparation as Figure 1). The left panels show DF maps, while the right panels show the SAN and atrial OAP recordings and the corresponding frequency power spectrum.
Panel C - OAP recording during ACh/Iso induced AF (panel B) from the SAN region broken up into three components: Central SAN (blue #1), Superior SACP (green #2), and Inferior SACP (red #3).
Panel D - Enlarged views of the SAN activation map (pink dotted rectangle in Panel A) during times shown by black dotted rectangle in Panel C.

