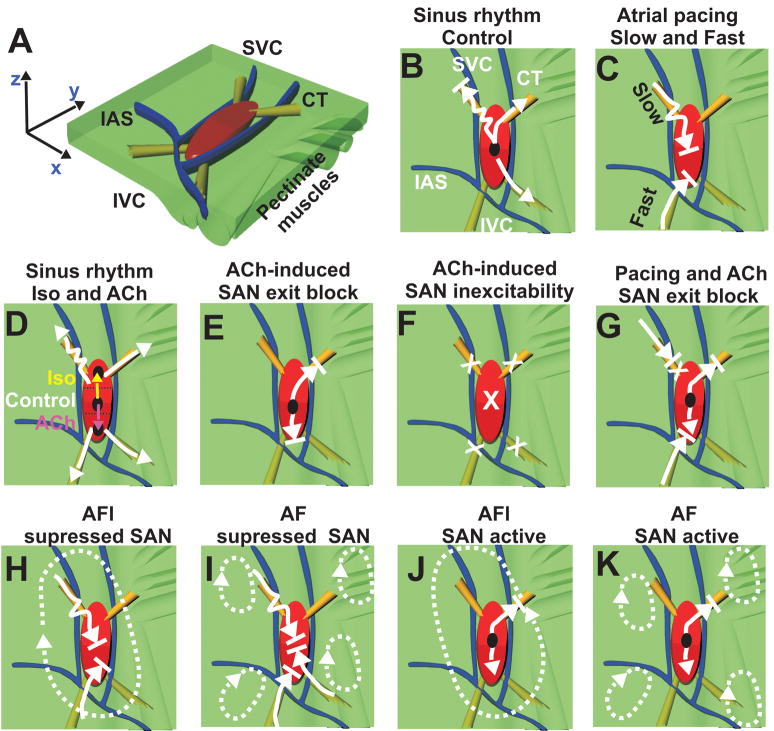
Figure 8. The canine SAN model: SAN activity during normal SR, atrial pacing and reentrant arrhythmias.
Panel A - Perspective, epicardial view of the canine SAN model with the orientation and location of the pectinate muscles (green bundles) defined. A 3D model of the SAN based on the functional and structural data was created using the Rhinoceros 3D software (McNeel). The atrial myocardium (green) and the three bifurcating coronary arteries (blue) surround the SAN (red). The yellow bundles show the SACPs.
The remaining panels (Panels B–K) were observations from the optical recordings overlaid on an epicardial view of the model with the same anatomical orientation. Black circles show leading pacemaker sites inside or outside of the SAN. The white arrows show the preferential directions of the excitation propagation through SAN pathways. Squiggled arrows represent conduction with decrement. Arrows with a line at the tip represent blocked conduction. X’s represent complete inhibition. Dotted white arrows show AF/AFL reentrant circuits.

