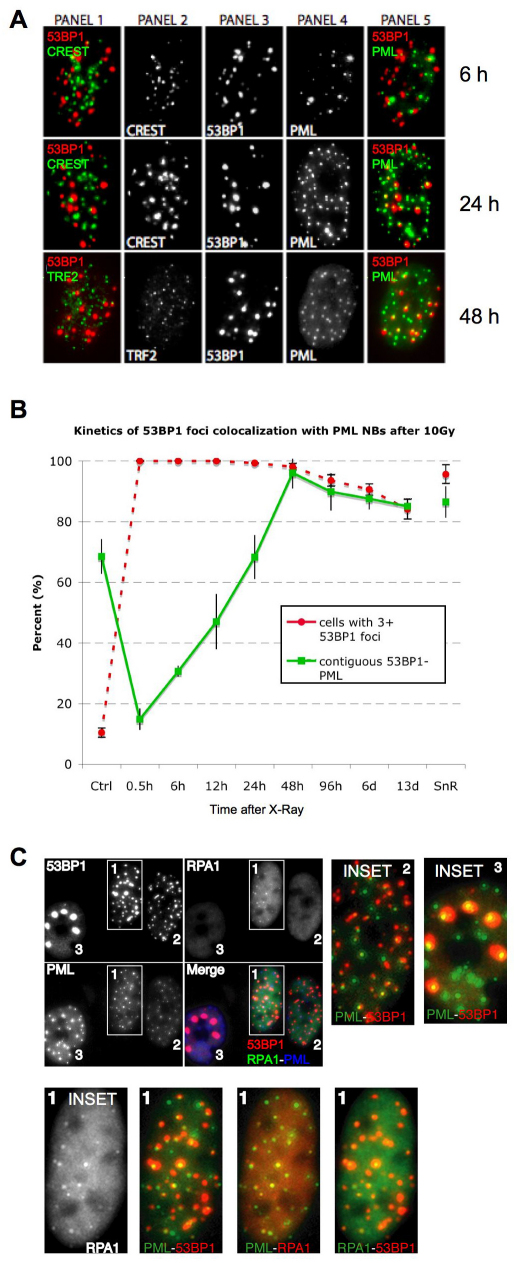
Fig. 3.
DNA-SCARS associate with a subset of PML NBs. (A) HCA2 cells were irradiated with 10 Gy and followed for 6 or 24 hours before being fixed and stained for CREST (panel 2), 53BP1 (panel 3) and PML (panel 4). At 6 and 24 hours, panel 1 shows CREST (green)–53BP1 (red) colocalization (yellow), and panel 5 shows 53BP1 (red)–PML (green) colocalization (yellow). The same cells were also stained for TRF2 (panel 2), 53BP1 (panel 3) and PML (panel 4) 48 hours after irradiation. Panel 1 shows TRF2 (green)–53BP1 (red) colocalization (yellow), and panel 5 shows 53BP1 (red)–PML (green) colocalization (yellow). (B) Cells were irradiated with 10 Gy, then fixed and stained at the indicated intervals thereafter. Cells were scored for the percentage of cells with three or more 53BP1 foci (red line) and the extent to which individual 53BP1 foci totally or partially overlapped with a PML NB (green line). Shown are the means ± s.d. from three or more independent measurements. (C) Cells were irradiated with 10 Gy. Twenty four hours later, they were fixed and stained for 53BP1 (red in merge), RPA (green in merge) and PML (blue in merge). Cells in the selected field, also shown in Fig. 1A for 53BP1 only, were labeled 1–3, and individual colocalizations are shown in the insets (one selected protein is displayed in green, the other red and colocalization in yellow). In cells 2 and 3, colocalization between 53BP1 and PML is shown. For cell 1, which displays RPA foci, all combinations are shown.

