Fig. 7.
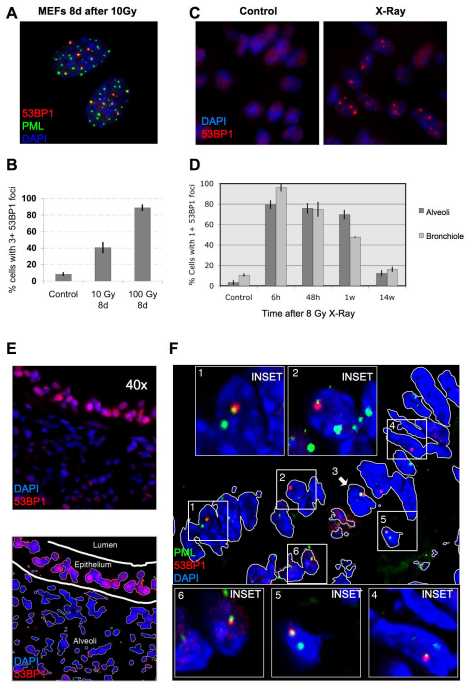
DNA-SCARS are detected in vivo in irradiated mouse tissues. (A) MEFs (early passage) were irradiated with 10 Gy. Eight days later, they were fixed and stained for 53BP1 (red), PML (green) and DAPI (blue). (B) MEFs were irradiated with 10 or 100 Gy. Eight days later, they were stained as in (A) and analyzed for the percentage of cells with three or more 53BP1 foci associated with PML NBs. Shown are the means ± s.d. from three or more independent measurements. (C) Lungs from three-month-old C57BL6 mice were analyzed by immunofluorescence using fresh frozen sections. Representative 53BP1 staining (red) is shown in a control (left panel) animal or an animal irradiated with 8 Gy and analyzed 7 days later (right panel). Nuclei were counterstained with DAPI (blue). (D) Lung alveoli and bronchiolar epithelial cells from control or irradiated animals that were allowed to recover for the indicated periods after 8 Gy irradiation. The percentage of cells with at least one 53BP1 foci was quantified in three independent images from frozen lung sections similar to that displayed in C. Error bars show the s.d. from three independent measurements (total number of nuclei counted; for each time point, n=600 or more for lung alveolar cells and n=300 or more for bronchiolar epithelial cells). (E) Representative 53BP1 staining (red) of the lung bronchiolar epithelial cells in control mice (nuclei counterstained with DAPI). The lower panel outlines the epithelial cell layer. (F) A lung section from an irradiated animal that was allowed to recover for 7 days after 8 Gy irradiation, stained for 53BP1 (red), PML (green) and DAPI (blue) and analyzed by confocal microscopy. The six cells that displayed 53BP1–PML colocalization are boxed and numbered and magnified in the insets. The thin white lines in the main image outline the periphery of the nuclei.

