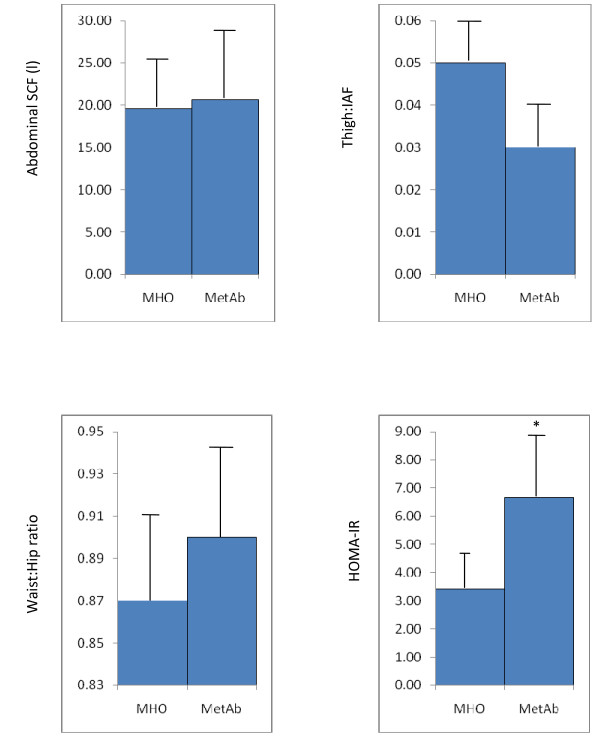
Figure 2.
Comparison of abdominal subcutaneous fat (SCF), thigh fat:IAF, waist:hip ratio (WHR) and HOMA-IR in metabolically normal (MHO n = 20) and those with any metabolic abnormality (MetAb n = 19. All values are geometric means with 95% CI, except WHR (mean; 95% CI). The symbol * indicates the groups are significantly different from each other (p < 0.01)

