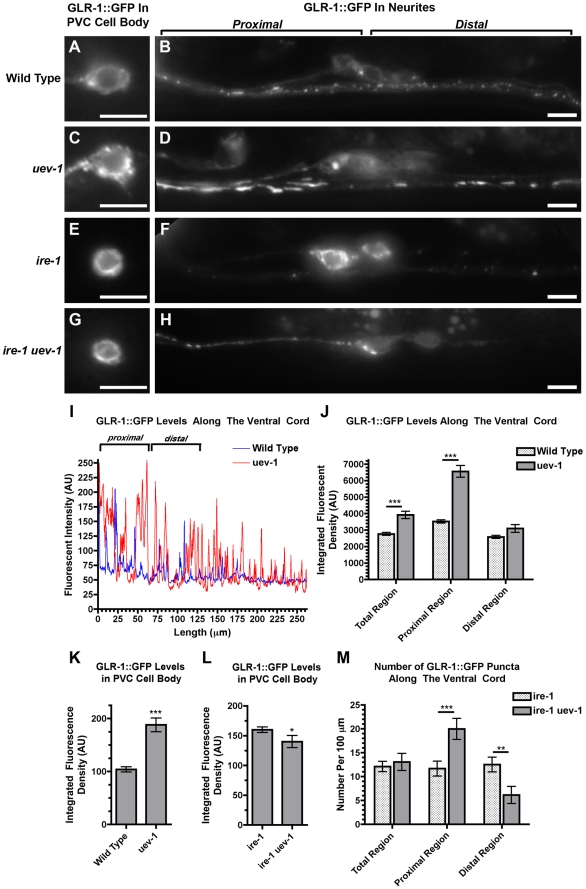
Figure 5. UEV-1 regulates both GLR-1 levels and spatial distribution.
(A–H) GLR-1::GFP fluorescence in (A, C, E, G) neuron cell bodies and (B, D, F, H) along the ventral cord for (A, B) wild type, (C, D) uev-1(od10) mutants, (E, F) ire-1 mutants, and (G, H) ire-1 uev-1 double mutants. To quantify the unusual spatial distribution of GLR-1 in uev-1 mutants, the region 65 microns anterior (left in the figure) of the RIG/AVG cell bodies (these neurons contribute little GLR-1::GFP to the ventral cord, used here solely as a landmark) was considered as “proximal” to the neuron cell bodies of the command neurons in the head (AVA, AVB, AVD, AVE, and PVC, which contribute almost all of the GLR-1::GFP along the ventral and are outside of the images in this figure), whereas the region 65 microns posterior (right in the figure) of the RIG/AVG cell bodies were considered as “distal” to the command neuron cell bodies. The images in E–H were collected at several times the exposure as the images in A–D as no single exposure time possessed the dynamic range to precisely capture all four genotypes. (I) Line profiles for GLR-1::GFP fluorescent intensity along the ventral cord for a wild-type animal (blue) and a uev-1(od10) mutant (red) after removal of background autofluorescence. Baseline is a measure of unlocalized GLR-1::GFP levels. Brighter GLR-1::GFP puncta are observed more proximal along the neurites to the cell bodies. This proximal-distal bias is increased in uev-1 mutants compared to wild type. (J) Mean GLR-1::GFP fluorescence (sum of pixel values) along the ventral cord for either the total cord, the proximal region, or the distal region for wild type (stippled) or uev-1 mutants (gray). (K, L) GLR-1::GFP fluorescence (sum of pixel values) observed in the PVC neuron cell bodies for the indicated genotypes. (M) Mean number of GLR-1::GFP puncta along the ventral cord (per 100 micron length) for either the total cord, the proximal region, or the distal region for wild type (stippled) or uev-1(od10) mutants (gray). Bar, 5 microns. Error bars are SEM. N = 20–30 animals for each genotype. (J, M) **P<0.01, ***P<0.001 by ANOVA with Bonferroni multiple comparison tests (only shown for wild type versus mutant for each reporter). (K, L) *P<0.01, ***P<0.0001 by t-test.

