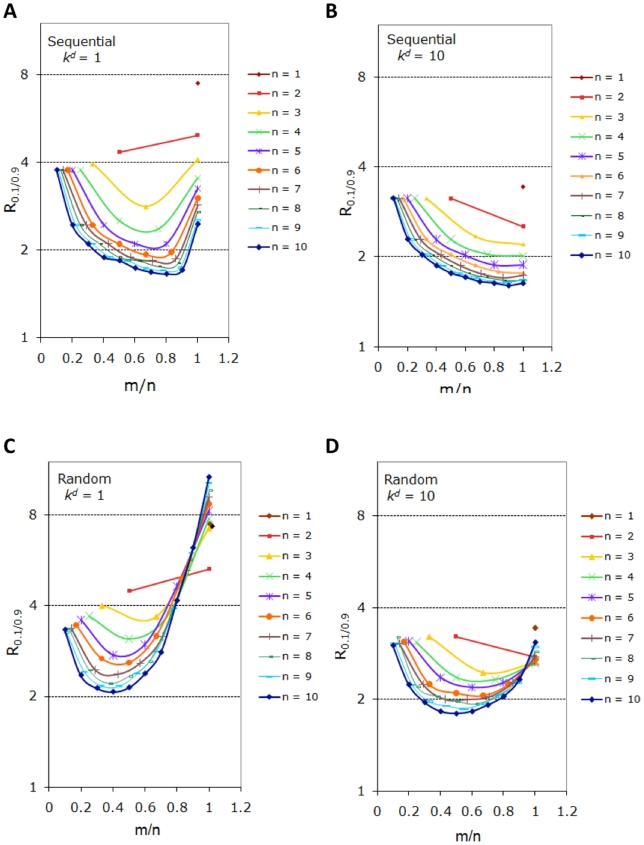
Figure 7. Rates of phosphorylation/dephosphorylation vs. degradation.
Systems with slow and fast degradation rate constants are compared in terms of sharpness of the temporal profile of the non-degradable fraction for sequential (A–B) and random (C–D) processes. The response coefficients are shown for the following parameters:  ,
,  ,
,  ,
,  .
.

