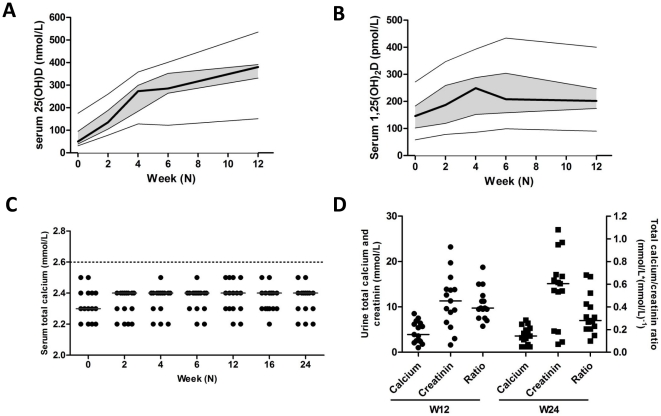
Figure 1. Vitamin D and calcium metabolism during supplementation.
A–B) The serum levels of 25(OH)D (A) and 1,25(OH)2D (B) are shown for the study visits at week 0, 2, 4, 6, and 12. The thick line indicates the median level, the grey zone the interquartile range. The thin lines show the minimum and maximum values. C) Total serum calcium levels at all study visits (week 0, 2, 4, 6, 12, 16, and 24). Hypercalcaemia is designated as a serum total calcium level ≥2.6 mmol/L. The grey lines indicate the median values. D) Urine levels of total calcium and creatinine levels and their ratio at week 12 and 24. Hypercalciuria is designated as a urine total calcium/creatinine ratio >1.0 mmol/L*(mmol/L)−1. The lines indicate the median values.

