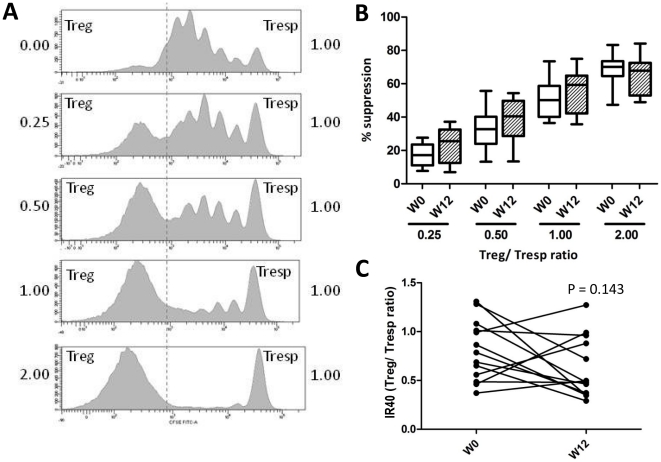
Figure 3. Regulatory T cell suppressive function.
A) A representative example of the CFSE signal in the CD4+7AAD− lymphogate. The upper panel (0.00) shows proliferation of Tresp cells without Treg. Co-culture with an increasing proportion of Treg results in an inhibition of Tresp cell proliferation (downward panels, ratio 0.25∶1, 0.5∶1, 1∶1 and 2∶1, respectively). An increasing proportion of CFSE− Treg can be observed, and a subsequent decrease of proliferating CFSE+ Tresp cells. Between the Treg/Tresp ratio 0.25 and 2.0, all patients achieved at both time points (week 0 and 12) 40% suppression of proliferation (IR40). B) The box and whisker plots show the suppression at each Treg/Tresp ratio before (week 0, open boxes) and after supplementation (week 12, dashed boxes). The boxes show the interquartile range, the whiskers the minimum and maximum value. C) IR40 before and after vitamin D3 supplementation (week 0 and 12).

