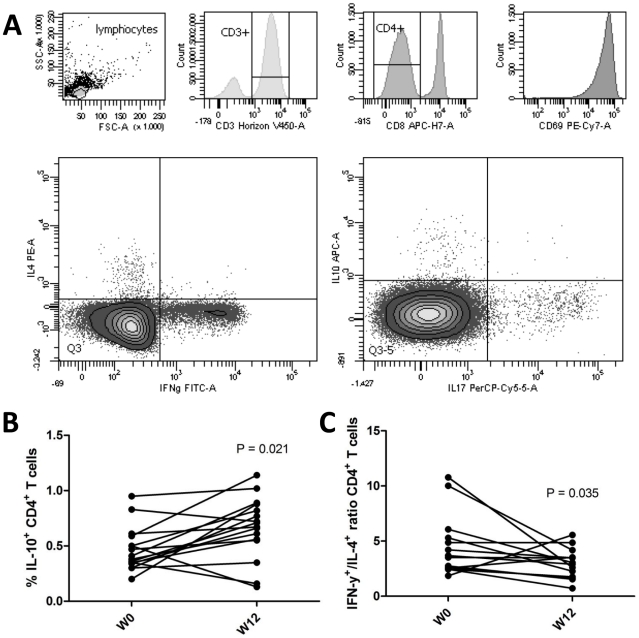
Figure 4. T helper cell cytokine profiles.
A) One million PBMC were stimulated for 5 hours with PMA and calcium ionomycin in the presence of monensin, and subsequently stained for flow cytometric analysis. In the lymphogate, CD3+CD8− cells were assessed for the proportions of IFN-γ+, IL-4+, IL-17+ and IL-10+ cells. CD69 was included to evaluate activation. B) The proportions of IL-10+ CD4+ T cells before and after supplementation. C) The ratio between Th1 (IFN-γ+) and Th2 (IL-4+) cells before and after supplementation. Significance was assessed with the Wilcoxon signed ranks comparison test.

