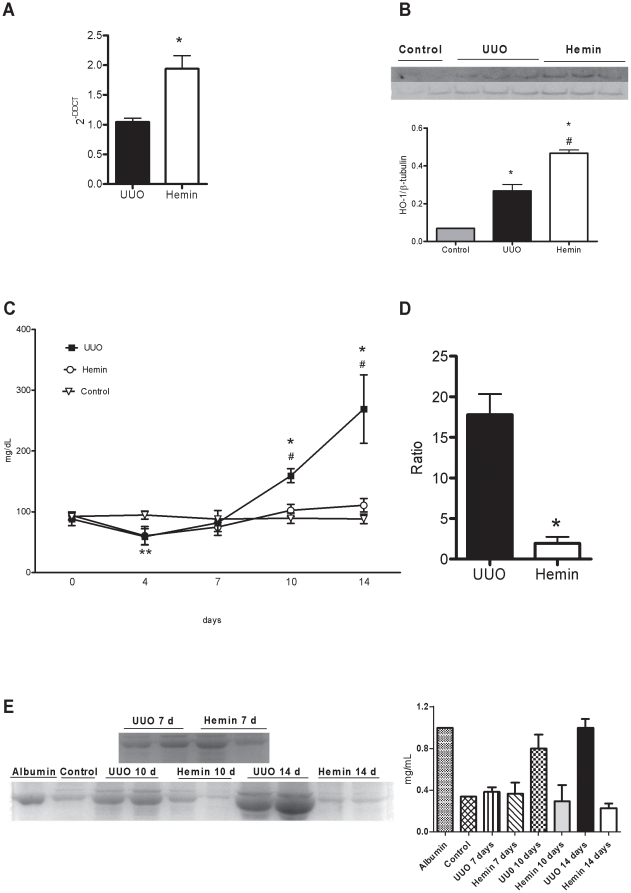
Figure 7. Treatment with Hemin after established fibrosis upregulates HO-1 and improves renal function to that observed in control animals 14 days post-obstruction.
(A) HO-1 gene expression, evaluated by RT-PCR, of samples obtained from obstructed kidneys of UUO and Hemin-treated animals. Kidney samples from normal rats were processed and used as control, with mRNA expression assigned a value of 1. * p<0,05 vs UUO. (B) HO-1 protein production as assessed by Western Blotting from control, UUO and Hemin-treated groups. The top panel shows the immunoblot of the HO-1 protein. The samples were also probed with a β-tubulin antibody as a control for the experiment. The graph represents the digital optic quantification of HO-1 protein production divided by β-tubulin protein production. * p<0,05 vs. Control and # p<0,05 vs. UUO. (C) Urine protein kinetics of control, UUO and Hemin-treated groups. UUO and Hemin groups underwent unilateral ureter obstruction and the latter received the HO-1 inducer on days 6 and 7 after surgery. *p<0,05 vs. Hemin, # p<0,05 vs. Control and **p<0,05 vs. Hemin and UUO. (D) Urine protein/creatinine ratio was calculated from the obstructed pelvis of UUO and Hemin-treated animals after 14 days. *p<0,001 vs. UUO. (E) Urine albumin excretion analysis. The left panel represents an SDS-PAGE showing the molecular weight of albumin. The graph expresses the digital optic quantification from the SDS-PAGE. The data are expressed as average ± s.e.m.

