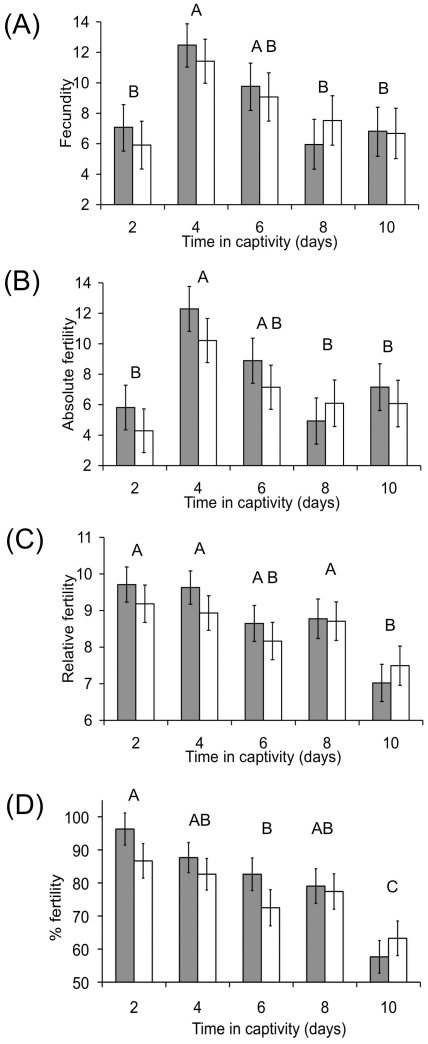
Figure 2. Changes in fecundity (A), absolute fertility (B) relative fertility (C) and percentage fertility (D) over time in captivity for females that received a single additional mating (shaded bars) or an interrupted mating (open bars).
Time periods that are not connected by the same letter are significantly different (Tukey HSD comparison of pooled (mated plus interrupted) means). Data displayed as least squares means ± SE.

