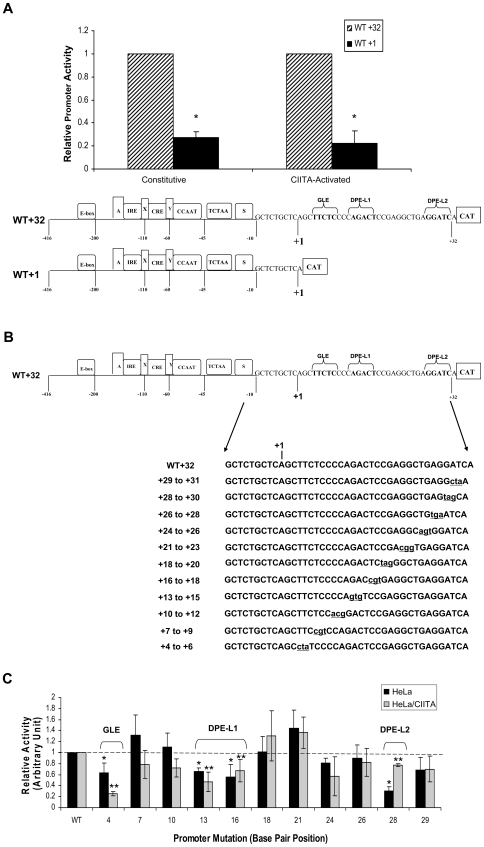
Figure 2. Three downstream elements reside in the downstream region of the MHC class I promoter.
A) Sequences downstream of +1 regulate class I promoter activity in both constitutive and activated transcription. CAT reporter constructs (5 ug) extending from −416 bp to either +1 (WT+1) to or +32 bp, (WT+32) (see diagram) were transfected into either HeLa cells or HeLa/CIITA cells that stably express CIITA. Promoter activity was assessed by the level of CAT activity as described in Materials and Methods. (*)- denotes a significant (p<0.05) difference between the activities of WT+1 and WT+32, as determined by T-test. This experiment is representative of three independent experiments, each done in duplicate independent transfections. Error bars indicate standard deviation. The absolute levels of MHC class I promoter activity cannot be compared between the HeLa and HeLa/CIITA cell lines due to endogenous CIITA activation of class I promoter activity in the HeLa/CIITA cells. The effect of CIITA in absolute levels of MHC class I promoter activity is shown in the Supplemental Figure S2. B) Schematic illustration of scanning mutations. Downstream promoter region mutations were generated in sequential 3 bp clusters, located between +4 bp and +29 bp, within the context of an extended class I promoter with a 5′ terminus at −416 bp and a 3′ terminus at +32 bp. This promoter segment contains an upstream regulatory region that includes series of enhancer elements, a minimal core promoter and the downstream promoter region. Promoter mutation constructs were ligated to a CAT reporter to assess relative promoter activity. Mutations are shown in lower case. C) Promoter mutations identify three functional elements in the downstream region of the class I promoter. Each of the scanning promoter mutations was transfected into HeLa cells (black) or HeLa/CIITA cells (grey) and promoter activity determined relative to a wild type control as measured by recovered CAT activity as described in Materials and Methods. The graph summarizes the results of 4 separate experiments, each with duplicate independent transfections. Error bars indicate standard deviation. (*) and (**) denote significant (p<0.05) differences between the activities of mutant constructs relative to the wild type in HeLa cells and HeLa/CIITA cells, respectively.

