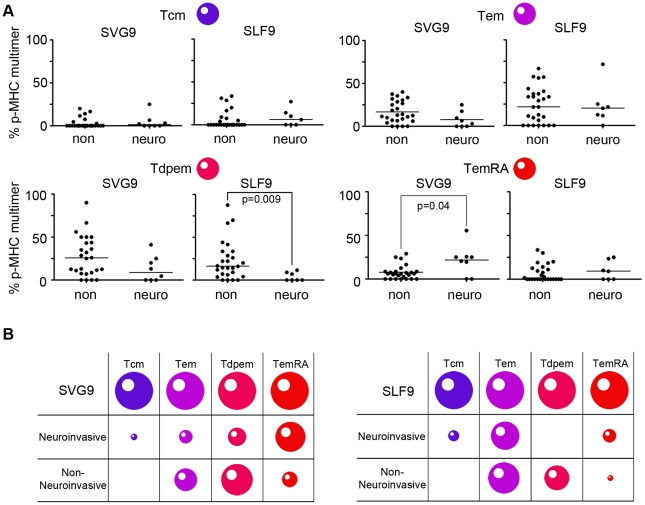
Figure 4. Distinct Phenotype of SGV9 and SLF9 specific cells correlate with neuroinvasive symptoms.
(A) Memory phenotypes of antigen experienced T cells from donors with or without neuroinvasive symptoms are shown, based on expression of CD27, CD45RA, CCR7, CD57 as defined in Table 2. For data of a normal distribution, lines represent mean values and p values are from a student t-test analysis. For data of a non-normal distribution, lines represent median values and p values are from a Mann-Whitney test. (B) The size of each cell represents the median percentage of the prevalent memory phenotypes for each of the two clinical conditions.

