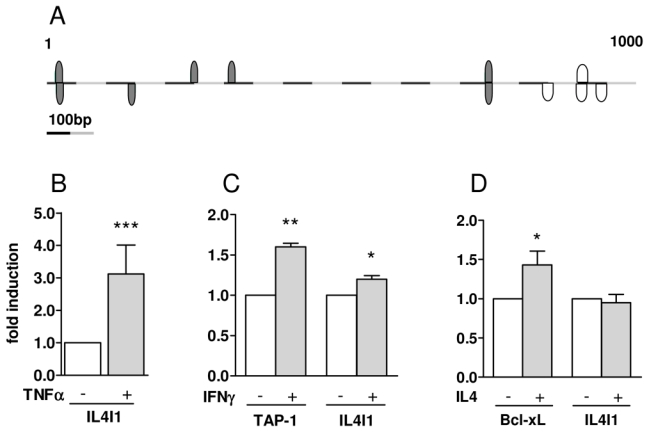
Figure 5. Transcriptional analysis of IL4I1 putative promoter region.

(A) Genomatix analysis of the 1000 bases upstream of transcription initiation of IL4I1 gene showing NFκ B putative binding sites (gray) and putative STAT binding sites (white). (B) HEK293 cells were cotransfected with a control firefly luciferase vector together with the 1000 bp sequence upstream of IL4I1 transcription initiation site inserted in pRL Null Renilla luciferase vector and stimulated or not with 25 ng/ml of TNFα. After an additional 24 hours, the cultures were harvested for determination of luciferase activity and Renilla luminescence reported to firefly luciferase luminescence as transfection normalisation. Results are expressed as the fold increase of specific luminescence compared to untreated controls. Data are the mean of 9 independent experiments ±SD. (C & D) HEK293 cells were co-transfected with 500 ng plasmid vectors coding for STAT1α(C) or STAT6 (D) either together with the IL4I1-promoter vector or the control TAP-1- or Bcl-xL-promoter vectors and the appropriate transfection controls as in B. Data are the mean of 5 independent experiments ±SD. * p < 0.05; ** p < 0.01, *** p < 0.001.
