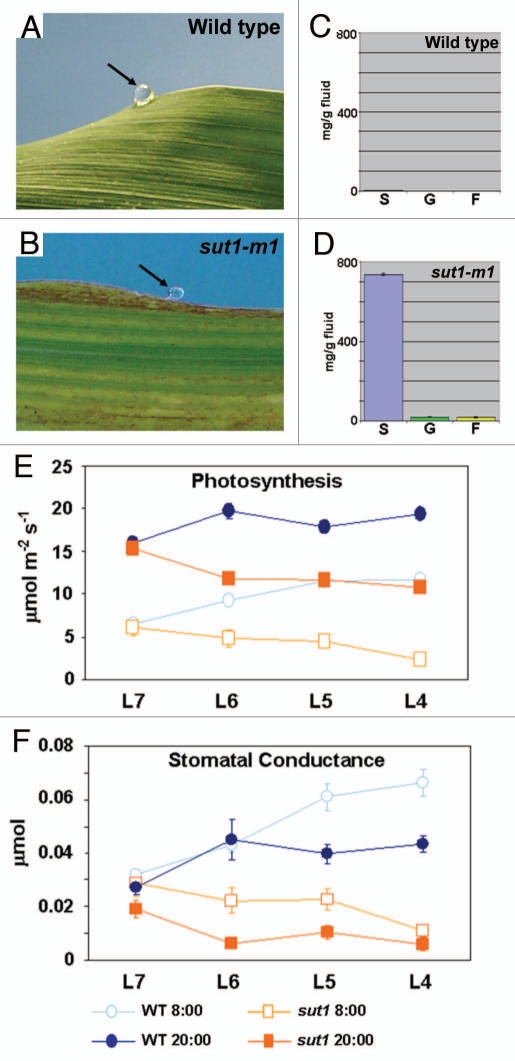
Figure 1.
Additional phenotypes of sut1 mutant plants. (A and B) Photographs of guttation fluid on leaf margins. (C and D) Graphs of quantifications of sucrose (S), glucose (G) and fructose (F) in guttation fluid. (A and C) Wild type. (B and D) sut1-m1 mutant. (E and F) Measurements of photosynthesis (E) and stomatal conductance (F) rates of wild-type and sut1-m1 mutant leaves. L7-L4 indicate leaves seven through four on three-week-old plants. Circles represent wild type and squares represent sut1 mutants. Open symbols indicate data collected at 8 AM and filled symbols indicate data collected at 8 PM (described in ref. 11).

