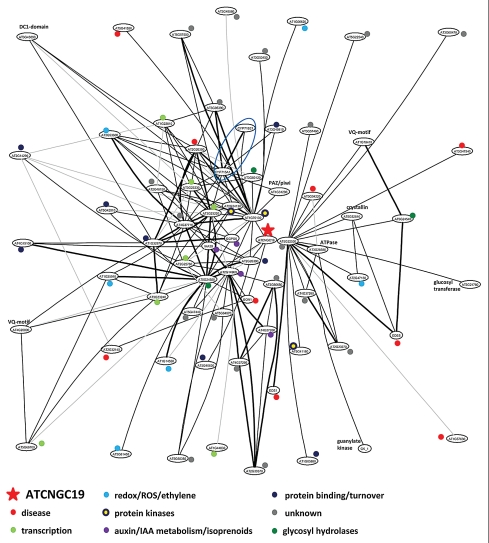
Figure 1.
Transcriptional network associated with ATCN GC19. The transcriptional network records correlation of expression using an algorithm that establishes partial correlation between the expression characteristics of any pair of genes in relation to the correlation of these genes with all other genes in the dataset. The figure shows the network at the highest level of stringency that sorted some 9,000 genes into a network. When probing for correlations of genes with ATCNGC19, the resulting network graph showed the presence of genes in functional categories that are related to disease resistance, protein turnover, auxin metabolism, and redox/ethylene signaling, next to a surprisingly large number of functionally unknown genes. Information about the network and lists of genes can be retrieved by using the command ‘sub(“ATCN GC19”,2)’ in the R-based GGM workspace included in Ma et al.7

