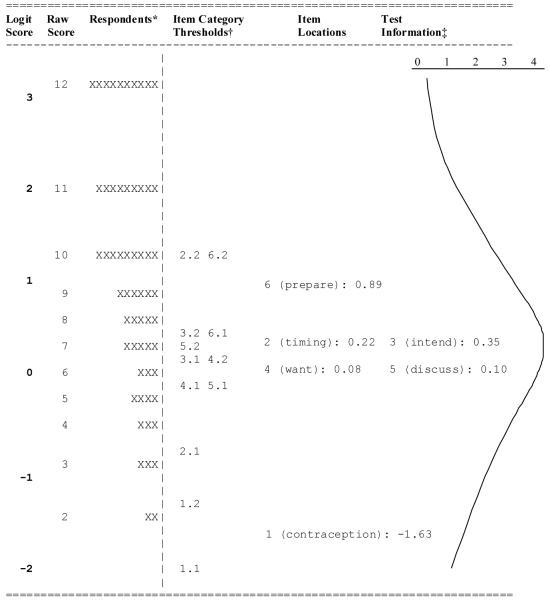
Figure 4.
Wright Map: LMUP logit scores, raw scores, respondent locations, item category threshold locations, item locations, and test information
Notes: aEach ‘X’ represents 15.9 respondents.
bItem category thresholds are labeled with the item level, and step threshold, respectively. An item-step threshold location represents the amount of “pregnancy planning” a respondent would need to have in order to have a 50% chance of selecting a response category on either side of the threshold. For instance, 4.1 represents the amount of "pregnancy planning" a respondent would need to have to have an equal (50%) chance of selecting the lowest category (did not want to have a baby) or selecting one of the two higher response categories on item 4.
cTest Information is the inverse square of the standard error of measurement at each level of the scale. LMUP items measure pregnancy planning with the most precision for participants falling just above 0 logits.

