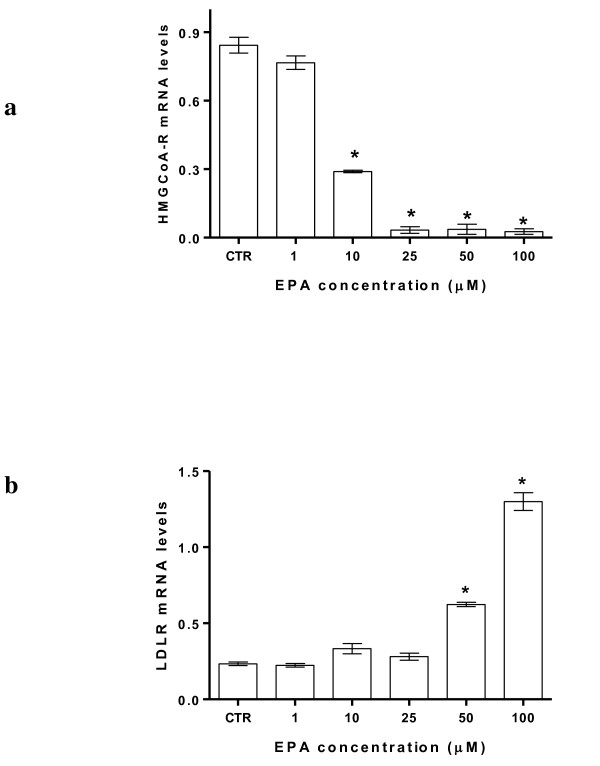
Figure 1.
EPA effects on HMGCoA reductase (panel a) and LDLR (panel b) mRNA levels in HepG2 cells. All data represent the mean ± SE of four consecutive experiments. mRNA levels are expressed as ratio of the amount of gene target by the amount of β-actin. P value was determined by one way analysis with Dunnett' post test. *P < 0.05 versus control

