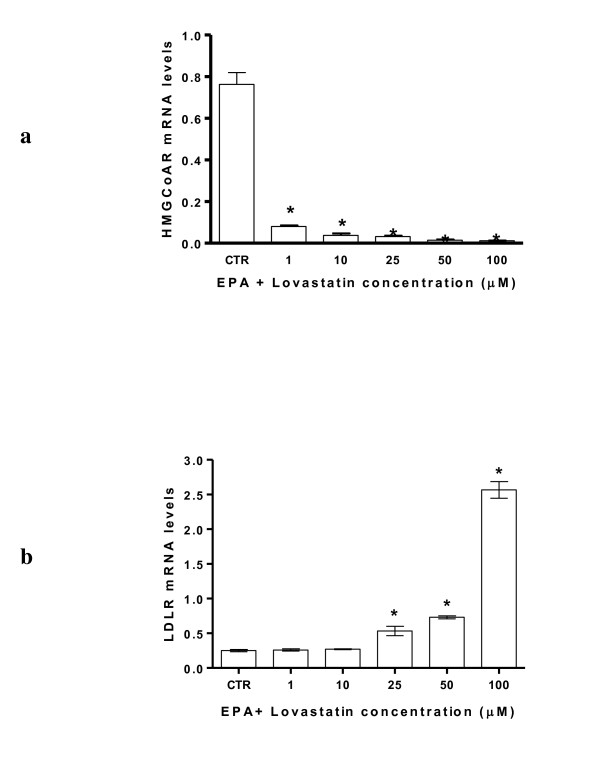
Figure 3.
HMGCoA reductase (panel a) and LDLR (panel b) mRNA levels after treatment with 50 μM of EPA and increasing concentrations of Lovastatin (1, 10, 25, 50 and 100 μM). All data represent the mean ± SE of four consecutive experiments. mRNA levels are expressed as ratio of the amount of gene target by the amount of β-actin. P value was determined by one way analysis with Dunnett' post test. *P < 0.05 versus control.

