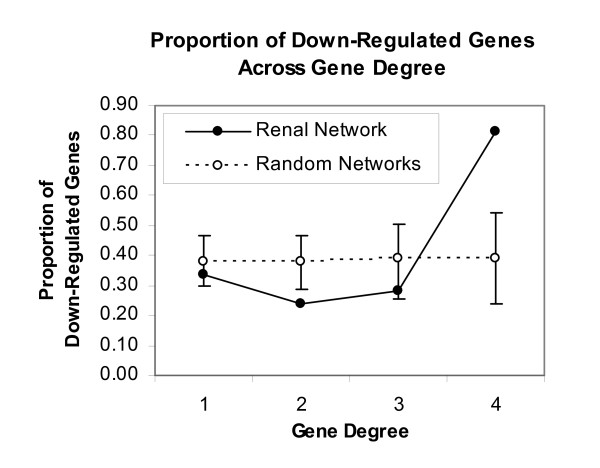
Figure 3.
The Relationship between Gene Degree and the Proportion of Down-Regulated Genes in the Renal Network. The proportion of down-regulated genes is much larger in high degree genes, compared to low degree genes. This pattern is significantly different from that generated from 1000 random networks of the same size and distribution. Two genes of degree 5 have been eliminated from the graph due their low number, making them inappropriate for the statistical comparison. However, as both of degree 5 genes were down-regulated, they follow the overall trend shown.

