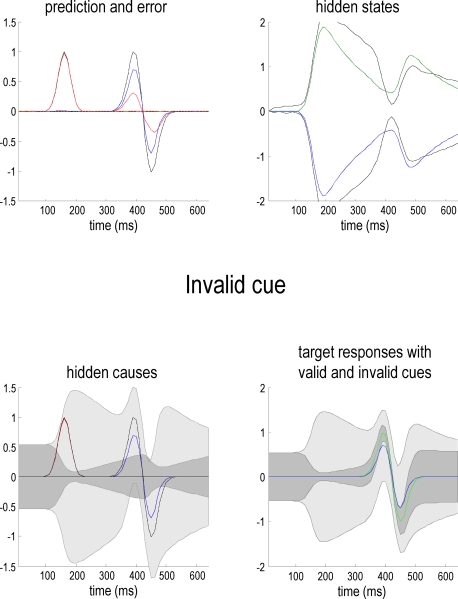
Figure 3.
This figure uses the same format as Figure 2 but shows responses to an invalid target (blue line) presented on the right. The predictions of this sensory channel are substantially less than the true value (compare the blue and dotted gray lines) with a consequent expression of prediction error (dotted red line). The conditional confidence regions for the conditional expectation of this invalid target (lower left panel) are now much larger than in the previous figure. This is shown in the lower right panel, where one can compare the conditional estimates of the valid (green; see Figure 2) and the invalid (blue) hidden cause, with their respective conditional confidences (gray). Note that these responses were elicited using exactly the same stimulus amplitude.

