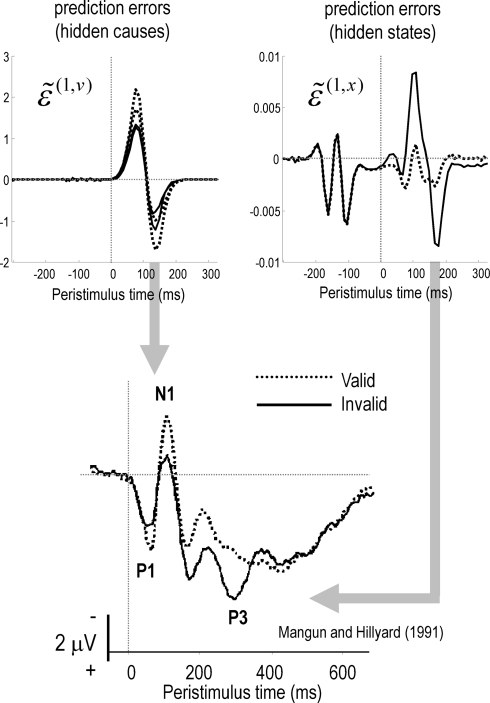
Figure 6.
Simulated EEG data from our simulations (upper panels) and empirical EEG data (lower panel) from Mangun and Hillyard (1991). The EEG traces were created from the prediction errors on the hidden causes (left) and states (right). The empirical data were recorded via EEG from the occipital cortex contralateral to the target (i.e., the cortex processing the target). The simulated data exhibits two important features of empirical studies: early in peristimulus time, stimulus-driven responses are greater for valid cues (upper left panel) relative to invalid cues. This is often attributed to a validity enhancement of early (e.g., N1) components. Conversely, later in peristimulus time, invalid responses are greater in amplitude. This can be related to novelty (and salience) responses usually associated with late waveform components (e.g., P3). In the simulations, this invalidity effect is explained simply by greater prediction errors on inferred hidden states encoding precision (upper right panel). It is these prediction errors that report a surprising or novel context, following the failure to predict invalidly cued stimuli in an optimal fashion.

