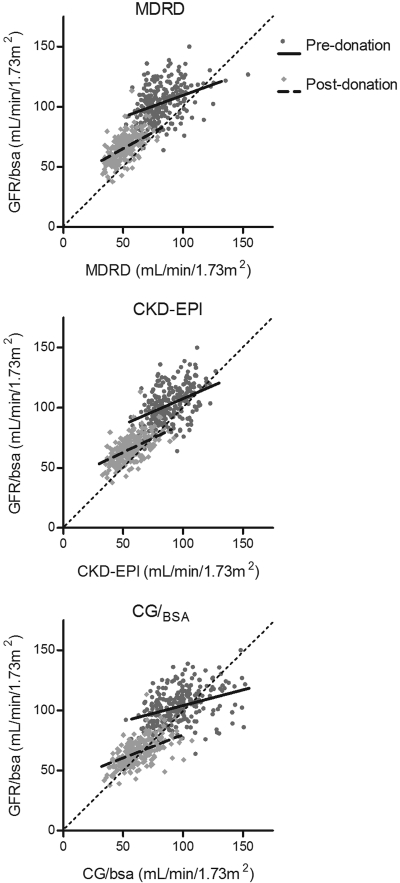
Figure 2.
Regression of eGFR on mGFR/BSA for all three equations for predonation (dark dots; solid line) and postdonation (gray diamonds; dotted line) values. Pre- and postdonation slopes of the regression lines are, respectively, 0.36 ± 0.05 and 0.55 ± 0.05 for MDRD, 0.43 ± 0.06 and 0.47 ± 0.04 for CKD-EPI, and 0.26 ± 0.04 and 0.39 ± 0.04 for CG/BSA.

