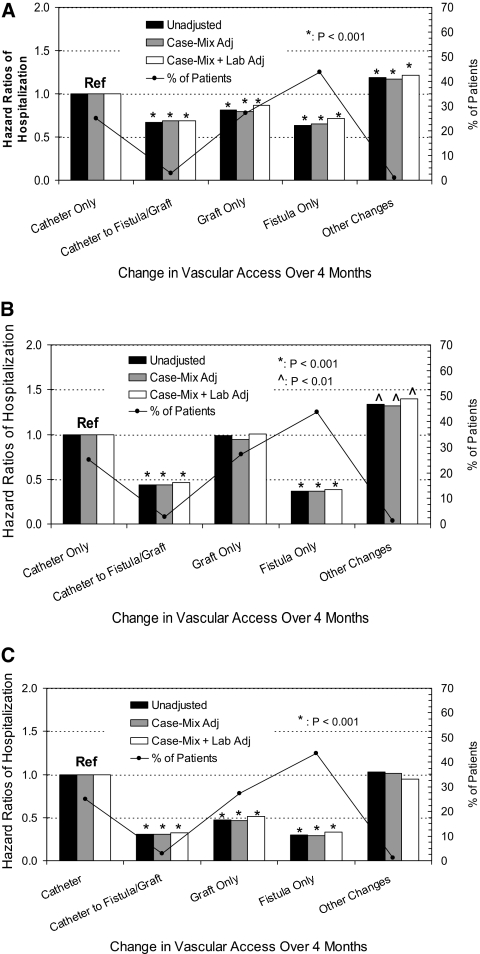
Figure 3.
Changes in access type (or maintaining the same access type during 4 months between January 1 and April 30, 2007) in all surviving patients (N = 70,852) and subsequent 1-year hospitalization risks from all causes (A); vascular access–related issues (B); and sepsis/bacteremia (C). The black line tracks the distribution of patients by vascular access category. Case mix includes age, gender, race, diabetes, and vintage, whereas lab includes eKt/V, albumin, hemoglobin, and phosphorus.

