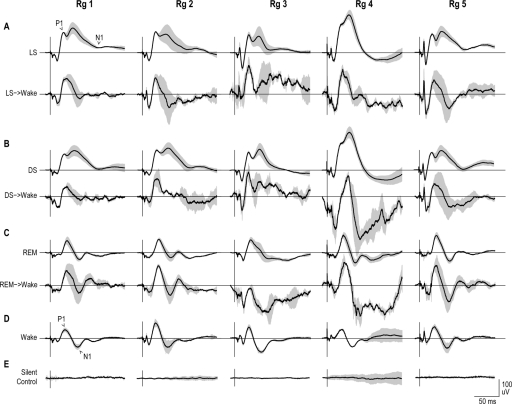
Figure 5.
Averaged (solid black line) and standard deviation (grey background) ERPs were plotted for each sleep state from all 5 animals (Rg # refers to the animal number). Panel A and B shows ERPs plotted for light quiet sleep (LS) and deep quiet sleep (DS) when the animal remained asleep (upper trace) and when the animal aroused from sleep (lower trace). Note the second prominent peak when the animal remained asleep, which contributed to the overall increase in ERP area and N1 latency during this condition. Panels C, D, and E show the ERPs plotted from REM states, wake, and silent control sessions correspondingly.

