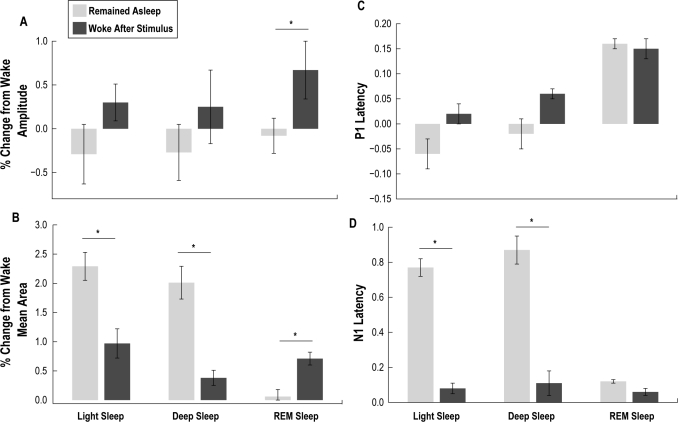
Figure 7.
ERP components were separated by amplitude (panel A), mean ERP area (panel B), P1 latency (panel C) and N1 latency (panel D). Light gray bars indicate ERP components when the animal remained asleep following a stimulus, presented as a percent change from the wake state. Dark gray bars represent ERP components when the animal aroused from a sleep state following a stimulus, presented as a percent change from wake. In panel A, P1-N1 amplitude showed no difference for both light quiet sleep (LS) and deep quiet sleep (DS), while REM showed an increase prior to arousal (REM: P = 0.01). In panel B, the mean area was greater during LS and DS when the animal stayed asleep following a stimulus (LS: P = 0.03; DS: P = 0.02), while REM showed an increase when the animal aroused (REM: P = 0.001). In panel C, we found no difference in P1 latency for any group tested (LS: P = 0.7; DS: P = 0.7; REM: P = 0.9), while N1 latency (panel D) was significantly increased for LS and DS when the animal remained asleep (LS: P < 0.001; DS: P < 0.001). Error bars shown indicate SEM across all recordings from all animals.

