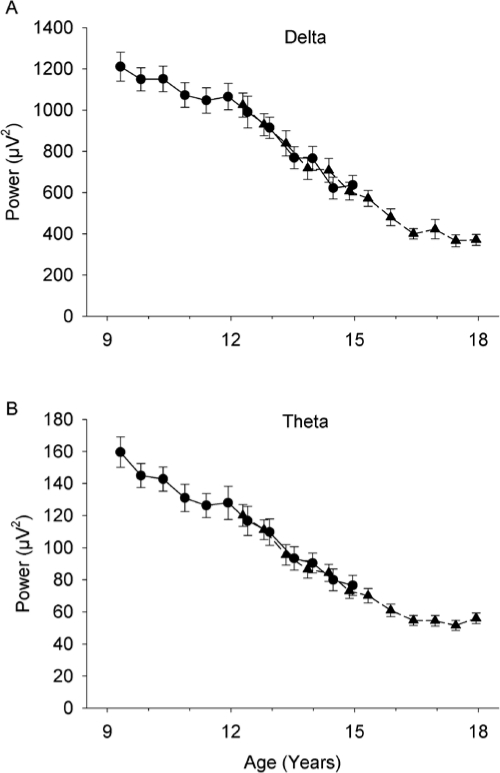
Figure 1.
Age related decline in all night (cycles 1-5) average NREM delta (1-4 Hz) power and theta (4-8 Hz) power. Mean (± SE) power at each semiannual recording is plotted against mean age for both the C9 (circles, solid lines) and C12 (triangles, dashed lines) cohorts. Both delta (A) and theta (B) power declined massively and significantly.

