
Figure 4.
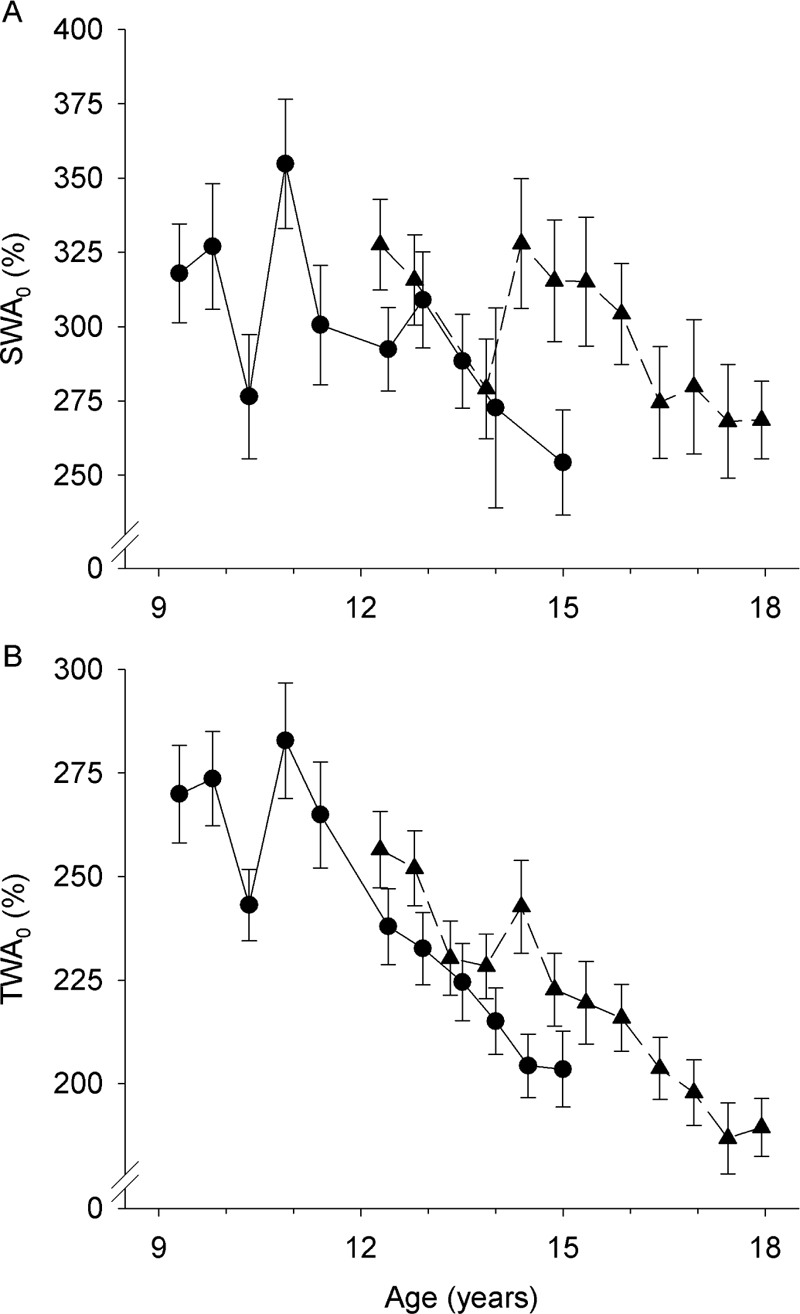
Nonlinear mixed-effect analysis estimates (± SE) of SWA0 (A) and TWA0 (B) for C9 (circles, solid lines) and C12 (triangles, dashed lines). Both process S parameters show a general decrease with age, but the effect is variable. Differences between the C9 and C12 cohorts in the 3 year period when the cohorts overlap are not statistically significant but further demonstrate the variability.