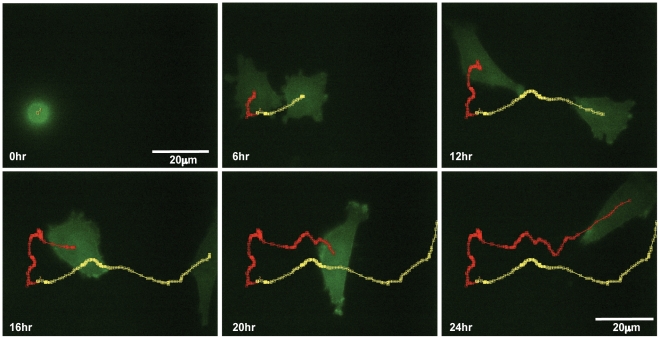
Figure 6. Live cell fluorescence microscopy using high-NA objective.
Insall chamber chemotaxis assay with identical set-up and analysis to experiment in Fig. 3, but the MV3 cells are stably transfected with GFP-Lifeact. Time-lapse images are taken every 5 minutes for 24 hours with and imaged with a 60x, 1.4NA oil immersion objective. Two daughter cells can be seen emerging from mitosis, polarising and then chemotaxing towards the FBS gradient. Their paths are highlighted by the red and yellow tracking lines.

