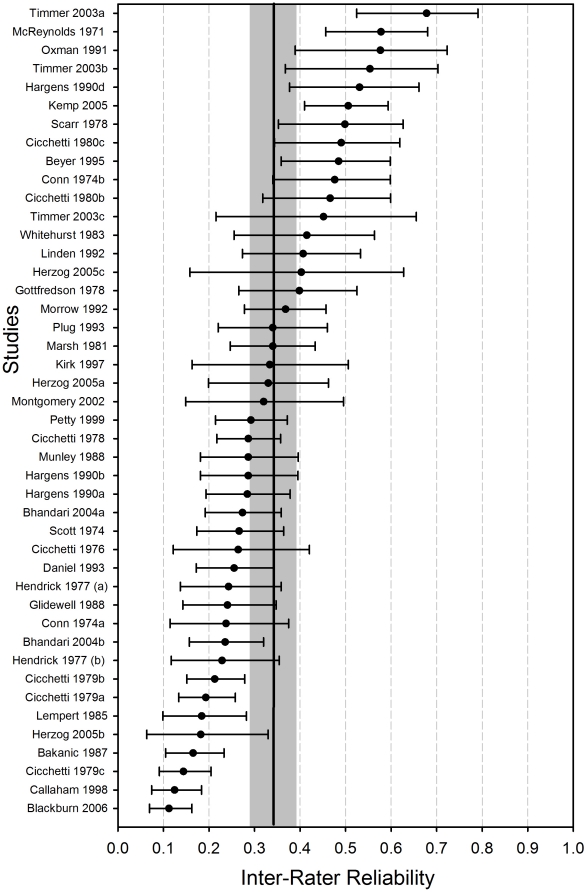
Figure 1. Forest plot of the predicted inter-rater reliability (Bayes estimate) for each study (random effects model without covariates) with 95% confidence interval (as bars) for each reliability coefficient (sorted in ascending order).
The 95% confidence interval of the mean value (vertical line) is shaded grey. Predicted values for the same author and year but with different letters (e.g., Herzog 2005a and Herzog 2005b) belong to the same study.

