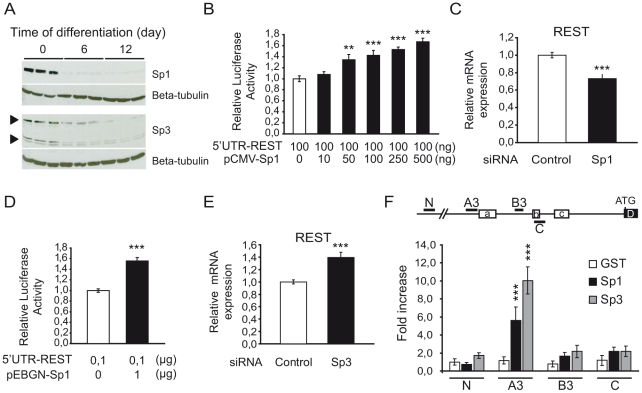
Figure 5. Sp1 and Sp3 regulate REST promoter activity in NG108 cells.
(A) Western blot analysis of the level of Sp1 and Sp3 protein in NG108 cells during 12 days of neuronal differentiation. (B) Effect of Sp1 overexpression on REST promoter activity. NG108 cells were cotransfected with 5′UTR-REST vector, increasing amount of Sp1 vector (pCMV-Sp1) and control beta-galactosidase expression vector. Cells were harvested 48 h later to measure luciferase and beta-galactosidase activities. pCMV vector was added to keep the DNA amount constant. Luciferase activity was normalized to beta-galactosidase and expressed as fold increase above the control vector (open bar). Data are the mean values ± sem of 3 independent experiments performed in triplicate. **P<0,01, ***P<0,001, cells transfected with pCMV-Sp1 vs cells transfected with empty pCMV vector alone. (C) Effect of Sp1 knockdown on REST mRNA expression. NG108 cells were transfected with specific Sp1 siRNA or control siRNA and analyzed 48 h later for REST mRNA level by quantitative RT-PCR. Each bar represents the mean value ± sem of at least 4 independent experiments performed in triplicate. ***P<0,001, Sp1 siRNA vs. control siRNA transfected cells. (D) Effect of a dominant-negative of Sp factors on REST promoter activity. 5′UTR-REST vector was cotransfected with an empty pEBGN vector (open bar) or with dominant-negative Sp1-encoding vector (pEBGN-Sp1) (solid bar) and beta-galactosidase expression vector into NG108 cells. Cells were harvested 48 h later to measure luciferase and beta-galactosidase activities. Luciferase activity was normalized to beta-galactosidase and activity of REST promoter without transfection of pEBGN-Sp1 was set to 1. Data are the mean values ± sem of 3 independent experiments performed in triplicate. ***P<0,001, pEBGN-Sp1 vs pEBGN transfected cells. (E) Effect of Sp3 knockdown on REST mRNA expression. NG108 cells were transfected with Sp3 siRNA or control siRNA and analyzed 48 h later for REST mRNA level by quantitative RT-PCR. Each bar represents the mean value ± sem of at least 4 independent experiments performed in triplicate. ***P<0,001, Sp3 siRNA vs. control siRNA transfected cells. (F) Sp1 and Sp3 bind REST promoter. ChIP assay was performed to detect Sp1 and Sp3 on REST promoter in NG108 cells using anti-Sp1 and anti-Sp3 antibodies. Sequences covering the regions A, B and C in mouse REST promoter corresponding to the regions A3, B3 and C in human REST promoter were amplified. As a negative control, a sequence 2.0 kb upstream of the region A (N) was amplified. Results are expressed as fold enrichment compared to value obtained after amplification of region N immunoprecipitated with an anti-GST antibody. Each bar represents the mean value ± sem of 6 independent IPs. ***P<0,001.

