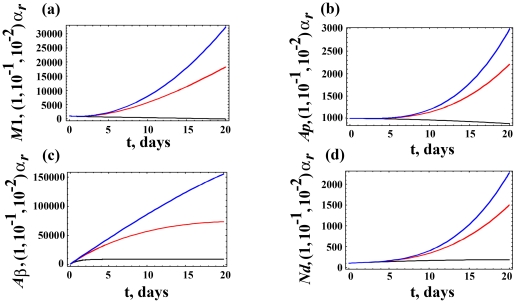
Figure 3. Dynamic variations of cell populations given distinct Aβ removal rate.
Variations in the (a) M1, (b) Ap, (c) Aβ, and (d) Nd populations over 20 years for three values of αr = 1× (black), 10−1× (red), and 10−2× (blue) the value reported in Table 1 for the Aβ removal rate. As αr decreases, there is an increase in neuropathogenesis so that all four populations increase.

