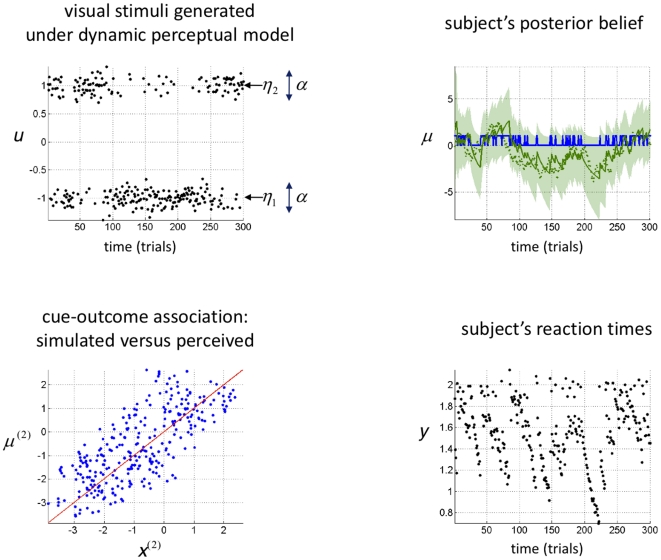
Figure 3. Variational Bayesian recognition of visual stimuli:
Upper Left: time series of sensory cues, sampled from the generative model summarized in Figure 2. Note that the discrimination ratio ( ) is approximately similar to that of the natural images (see Figure 2). Upper Right: Subject's posterior belief, as obtained using the inversion of the perceptual model given observed sensory cues (green: cue-outcome association, blue: visual stimulus category; solid line: posterior mean
  , shaded area: 99% posterior confidence interval, dots: sampled hidden states). Note that on each trial, the category of the visual stimuli was recognized perfectly. Lower Left: scatter plot comparing the simulated (sampled, x-axis) versus perceived (estimated, y-axis) cue-outcome associative strength. Lower right: simulated reaction times.

