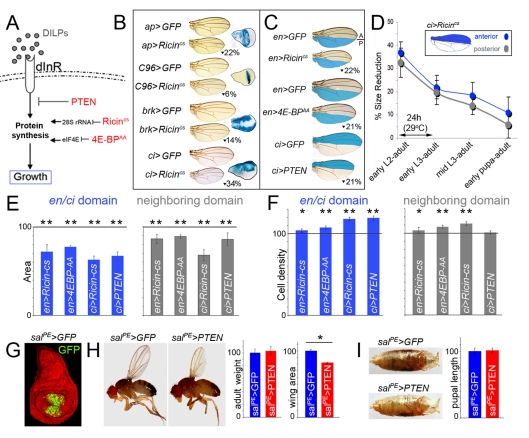
Figure 1. Adjacent cell populations attain a final size in a coordinated manner.
(A) Drosophila insulin-like peptides (DILPs) bind to the Insulin Receptor (dInR) and induce tissue growth by increasing the protein biosynthetic capacity of the cells. Three proteins, with well-known growth inhibitory functions in insulin signaling (PTEN) or protein biosynthesis (Ricincs, a cold sensitive version of Ricin-A, and 4E-BPAA, an activated form of 4E-BP), were expressed with the Gal4/UAS system in specific territories of the developing wing disc. (B, C) Cuticle preparations of adult wings expressing GFP, Ricincs, 4E-BPAA, or PTEN under the control of a range of Gal4 drivers. The reduction in wing size caused by Ricincs, 4E-BPAA, or PTEN expression when compared to GFP-expressing wings is shown. Expression domains of Gal4 drivers are shown in wing discs expressing the UAS-lacZ transgene and stained for β-Galactosidase activity (blue, A) or depicted in blue (C). Localized transgene expression induced a significant reduction in adult wing size when compared to GFP-expressing wings raised in the same conditions (p<10−4; see also Table S1). (D) Time-lapse experiments showing the coordinated reduction of tissue size throughout development. Animals expressing GFP or Ricincs in the ci-gal4-expressing domain (A compartment) were transferred to 29°C at different developmental time points until adult eclosion. Ricincs expression induced a coordinated reduction in tissue size in both A (blue) and P (gray) compartments. The areas of the A and P compartments were significantly reduced when compared to GFP control wings raised at 29°C (p<10−4; see also Table S4). (E, F) Histograms plotting the size (E) and cell density values (F), normalized as a percent of the control GFP-expressing wing values, of the en and ci domains expressing different transgenes (blue bars) and of the neighboring domains not expressing the transgene (gray bars). Error bars indicate standard deviation. The horizontal line shows the size or cell density values of the normalized control GFP-expressing wings. Areas were significantly reduced in the transgene-expressing and non-expressing domains (see also Table S2). Cell densities were significantly increased in those bars labeled by one or two asterisks (see also Table S3, * p<0.05 and ** p<0.01). (G) salPE-gal4; UAS-GFP wing disc labeled to visualize GFP (green) and DAPI (red). (H,I) Representative salPE-gal4; UAS-GFP and salPE-gal4; UAS-PTEN adult male flies (H) and pupae (I) with their corresponding histograms plotting the adult weight, wing area, and pupal length, normalized as a percent of the control GFP-expressing wing values. Error bars indicate standard deviation. Adult weight: 100±6 (salPE >GFP) and 103±8 (salPE >PTEN). Wing area: 100±4 (salPE >GFP) and 82±4 (salPE >PTEN). Pupal length: 100±5 (salPE >GFP) and 101±4 (salPE >PTEN). PTEN induced a significant reduction in wing area (p<10−9), while adult weight (p = 0.2) and pupal length (p = 0.8) were not significantly changed.

