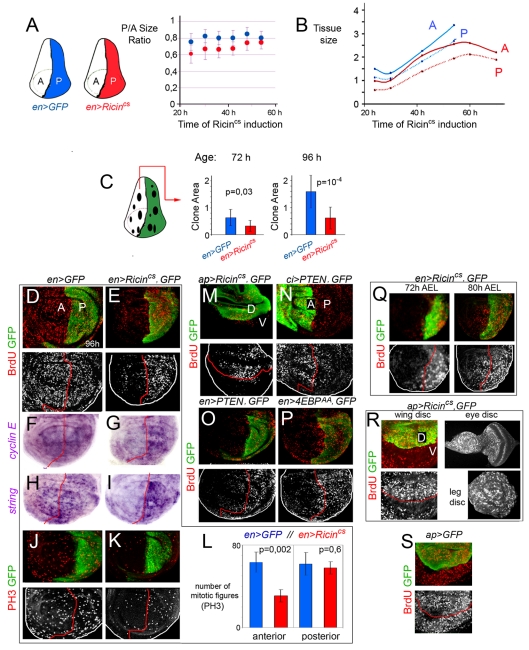
Figure 2. Targeted depletion of growth induces a non-autonomous reduction in growth and proliferation rates in adjacent cell populations.
(A, B) Plots representing the size ratio between the P and A compartments (A) and the absolute size (in arbitrary units) of the P and A compartments in en-gal4;UAS-GFP (blue dots) and en-gal4; UAS-Ricincs (red dots) wing discs raised to 29°C in early second instar and quantified 24–70 h later. P/A ratios (en>GFP): 24 h = 0.77±0.1, 30 h = 0.82±0.06, 36 h = 0.80±0.07, 42 h = 0.80±0.1, 48 h = 0.86±0.08, 54 h = 0.80±0.08. P/A ratios (en> Ricincs): 24 h = 0.61±0.12, 30 h = 0.67±0.14, 36 h = 0.67±0.11, 42 h = 0.67±0.08, 48 h = 0.75±0.09, 54 h = 0.75±0.09. Size (en>GFP): [24 h (A)] = 14±3; [24 h (P)] = 11±2; [30 h (A)] = 13±1; [30 h (P)] = 11±1; [42 h (A)] = 22±3; [42 h (P)] = 18±3; [54 h (A)] = 33±4; [54 h (P)] = 26±4. Size (en> Ricincs): [24 h (A)] = 10±3; [24 h (P)] = 6±2; [30 h (A)] = 10±0,3; [30 h (P)] = 6±1; [42 h (A)] = 21±4; [42 h (P)] = 14±3; [54 h (A)] = 25±11; [54 h (P)] = 19±4; [60 h (A)] = 26±9; [60 h (P)] = 21±6; [70 h (A)] = 22±4; [70 h (P)] = 19±3. (C) Histograms plotting the size of clones (in arbitrary units) located in the A compartment of en-gal4;UAS-GFP (blue bars) and en-gal4; UAS-GFP, UAS-Ricincs (red bars) wing discs. Clones were generated at the beginning of the Ricincs induction period and quantified 72 or 96 h later in third instar wing discs. Error bars indicate standard deviation. Size of clones at 72 h: en>GFP = 0.64±0.3; en> Ricincs = 0.33±0.2. Size of clones at 96 h: en>GFP = 1.56±0.6; en> Ricincs = 0.62±0.4. (D–K) en-gal4; UAS-GFP (D, F, H, J) and en-gal4; UAS-GFP, UAS-Ricincs (E, G, I, K) wing discs labeled to visualize BrdU incorporation (red or white), cyclin E or string mRNA levels (purple), PH3-positive cells (red or white), and GFP (green). (L) Histograms plotting the number of mitotic figures (PH3-positive cells) observed in the A and P compartments of en-gal4; UAS-GFP (blue bars) and en-gal4; UAS-GFP, UAS-Ricincs (red bars) wing discs. Error bars indicate standard deviation. Number of PH3-positive cells: en>GFP: A = 63±10, P = 62±11; en> Ricincs: A = 31±6, P = 58±6. 10 wing discs were scored per genotype. (M–P) Wing discs expressing GFP and Ricincs (M), PTEN (N, O), or 4E-BPAA (P) with the ap-gal4, ci-gal4, or en-gal4 drivers and labeled to visualize BrdU incorporation (red or white) and GFP (green). (Q, R) Wing discs from 72 h AEL and 80 h AEL third instar larvae (Q) and wing, leg, and eye imaginal disc of the same 96 h AEL third instar larvae (R) expressing GFP and Ricincs with the en-gal4 (Q) or ap-gal4 (R) drivers and labeled to visualize BrdU incorporation (red or white) and GFP (green). (S) Wing disc expressing GFP with the ap-gal4 driver and labeled to visualize BrdU incorporation (red or white) and GFP (green).

