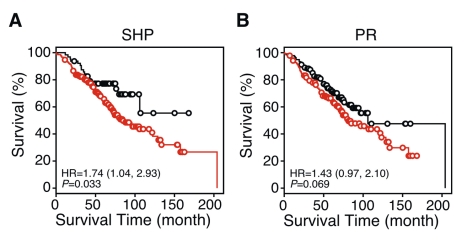
Figure 5. Kaplan-Meier survival plots showing single NR gene predictors in patients with stage I lung cancer.
Predictive models for SHP (A) and PR (B) were trained in the MDACC samples and tested in the patients with stage I lung cancer in the Consortium cohort. p-values were obtained by the log-rank test. Red and black lines represent predicted high- and the low-risk groups, respectively. Circles indicate censored samples.

