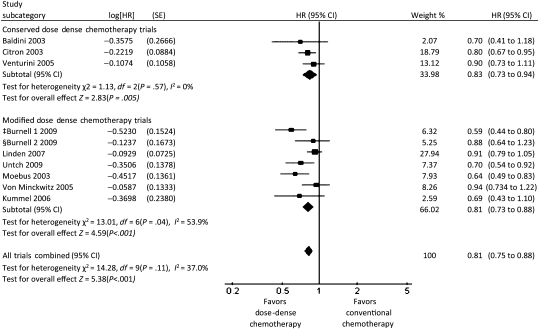
Figure 3.
Forest plot of hazard ratios (HRs) comparing disease-free survival for patients who received dose-dense chemotherapy vs those who received conventional chemotherapy in the conserved dose-dense chemotherapy trials, in the modified dose-dense chemotherapy trials, and for all trials combined. Hazard ratios for each trial are represented by the squares, the size of the square represents the weight of the trial in the meta-analysis, and the horizontal line crossing the square represents the 95% confidence interval (CI). The diamonds represents the estimated overall effect based on the meta-analysis fixed effect of all trials. ‡EC then T (dose-dense arm) vs AC then T. §EC then T (dose-dense arm) vs CEF.

