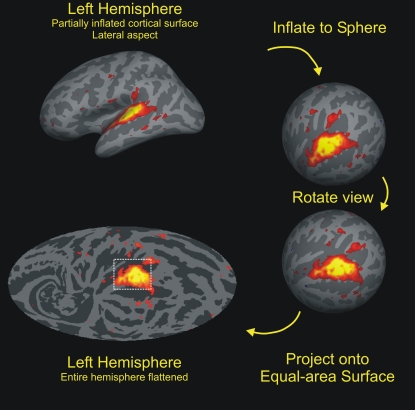
Figure 2.
Cortical-surface analysis. The cortex from each hemisphere was segmented with FreeSurfer (Fischl et al., 1999), then inflated to a sphere, and aligned to a hemispherically unified coordinate system. The functional and anatomical data were then mapped onto a Mollweide equal-area projection after rotating the sphere so that the intersection of Heschls’ gyrus (HG) and the superior temporal gyrus (STG) lay at the map center with the STG aligned along the equator. Auditory activations during visual attention conditions are shown on the average cortical anatomy of the left hemispheres (gyri are light, sulci are dark). Activations to non-attended tones were largely restricted to the regions of auditory cortex surrounding HG while activations during auditory attention conditions had increased spatial extent. Activations within the rectangular grid were quantified. Color scale: F(1,8) = 4.5–28.0 (red to yellow).

