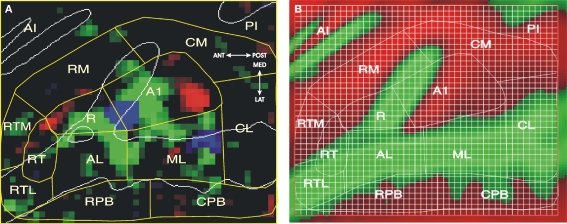
Figure 3.
Auditory cortical fields (ACFs). (A) Best-frequency map, showing best frequency at each voxel relative to the two other frequencies. Saturation codes the magnitude of frequency preference (range: 0.07–0.15% difference). Red = 3600 Hz, Green = 900 Hz., Blue = 225 Hz. ACFs (yellow lines) were assigned following the model of Kaas et al. (1999). Auditory core fields were identified by their mirror-symmetric tonotopic organization with surrounding belt fields divided at the boundaries between adjacent core ACFs. White lines indicate gyral boundaries. See text for ACF labels. (B) Model projected on average curvature map of the superior temporal plane (green = gyri, red = sulci), showing anatomical structures and grids used for quantification. CiS: circular sulcus; HG: Heschl's gyrus; HS: Heschl's sulcus; PT: planum temporale; STG: superior temporal gyrus; STS: superior temporal sulcus, LGI: long gyri of the insula.

