Figure 1.
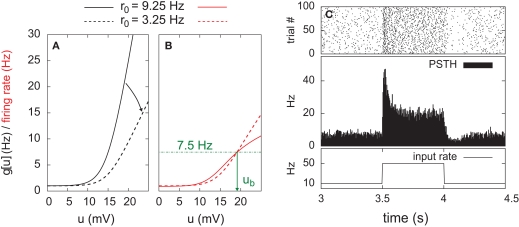
Stochastic neuron model. (A) The gain function g(u) (Eq. 4, solid line here) shows the momentary rate of a non-refractory neuron as a function of the membrane potential u. (B) The mean rate 〈g[u(t)]M(t)〉 of a neuron with refractoriness and adaptation is lower (solid red line). The baseline potential ub used in the simulation is defined as the membrane potential that yields a spontaneous firing rate of 7.5 Hz (green arrow and dashed line). In some simulations, we need to switch off adaptation, but we want the same holding potential ub to evoke the same 7.5 Hz output firing rate. The slope r0 of the gain function is therefore rescaled (A, dashed curve) so that the frequency curves in the adaptation and no-adaptation cases (B, solid and dashed red curves) cross at u = ub. (C) Example response property of an adaptive neuron. A single neuron receives synaptic inputs from 100 Poisson spike trains with a time-varying rate. The experiment is repeated 1000 times independently. Bottom: the input rate jumps from 10 to 50 Hz, stays there for half a second and returns back to 10 Hz (bottom). Middle: Peri-stimulus time histogram (PSTH, 4 ms bin). Top: example spike trains (first 100 trials).

