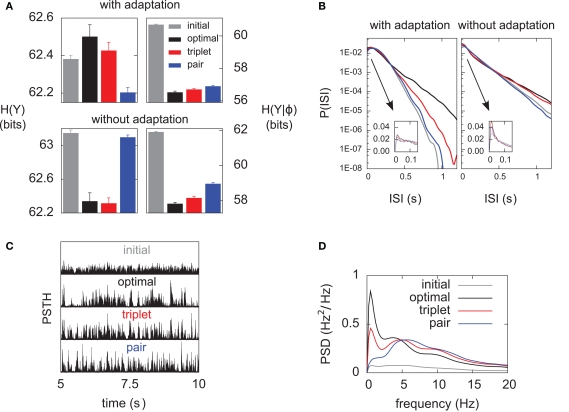
Figure 6.
Differential analysis of the entropies. The learning experiments are the same as in Figure 4, using hard-bounds on the synaptic weights. (A) Response entropy (left) and noise entropy (right) with (top) and without (bottom) postsynaptic SFA. Entropies are calculated at the end of the learning process, except for the gray boxes which denote the entropies prior to learning. (B) Interspike-interval distributions with (left) and without (right) SFA, after learning (except gray line, before learning). The main plots have a logarithmic y-scale, whereas the insets have a linear one. (C) Peri-stimulus time histograms (PSTHs) prior to learning (top) and after learning for each learning rule, over a full 5-s period. All plots share the same y-scale. (D) Power spectra of the PSTHs shown in (C), averaged over the 10 independent learning experiments.

