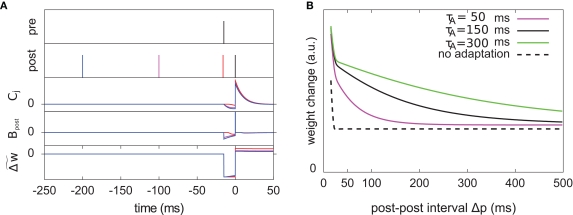
Figure 7.
The optimal model incorporates a triplet effect when the postsynaptic neuron adapts. (A) A pre–post pair (Δs = 15 ms interval, black lines in the first two rows) is preceded by another postsynaptic spike. The post–post interval Δp is made either 16 (red line), 100 (purple), and 200 ms (blue). The time course of Cj, Bpost, and the cumulative weight change are plotted in the bottom rows. (B) Total weight change (optimal model) as a function of the post–post interval, for various adaptation time constants, and without adaptation (dashed line).

