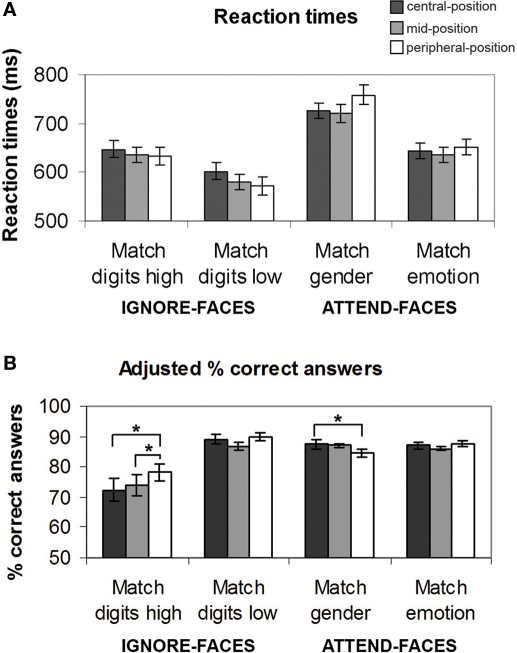
Figure 3.
Behavioral results for each task condition as a function of the location of the face stimuli. (A) Reaction times (mean ± SE). (B) Adjusted percent correct answers. See text for significant between-task differences. *Indicates significant (p < 0.05) differences between the effects at different spatial locations.

