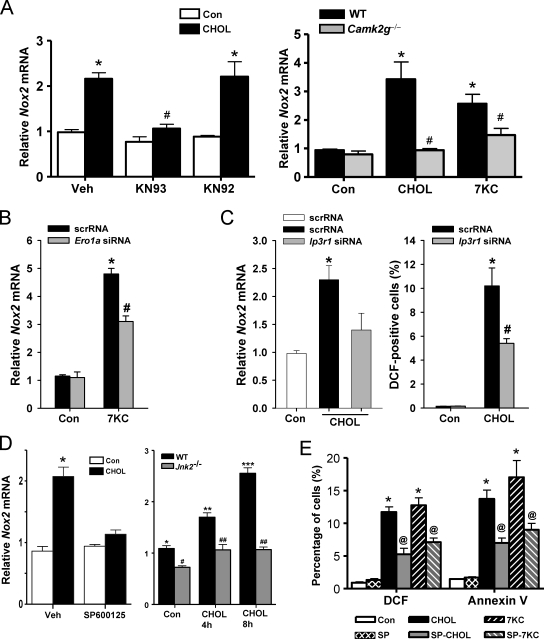
Figure 3.
Nox2 induction by ER stress is dependent on CaMKII, ERO1α, IP3R1, and JNK. (A, left) Macrophages were pretreated for 1 h in the absence or presence of 5 µM of the CaMKII inhibitor KN93, the inactive analogue KN92, or vehicle control (Veh), followed by incubation for 8 h without sterol (Con) or under cholesterol-loading conditions (CHOL). Nox2 mRNA was then measured by RT-QPCR. (A, right) Peritoneal macrophages from WT or Camk2g−/− mice were incubated for 8 h without sterol, under cholesterol-loading conditions, or with 7-ketocholesterol (7KC) and then assayed for Nox2 mRNA. (B) Macrophages were transfected with scrambled RNA (scrRNA) or Ero1a siRNA, which, after 72 h, led to an ∼50% decrease in ERO1α expression as assessed by immunoblotting (Li et al., 2009). The cells were then incubated an additional 8 h without sterol or with 7-ketocholesterol and then assayed for Nox2 mRNA. (C) Macrophages were transfected with scrambled RNA or Ip3r1 siRNA. After 72 h, IP3R1 expression was decreased by 60% as assessed by immunoblotting (Li et al., 2009). The cells were then incubated without sterol or under cholesterol-loading conditions for an additional 8 or 30 h and then assayed for Nox2 mRNA or DCF fluorescence, respectively. (D, left) Macrophages were pretreated for 1 h with 10 µM of the JNK inhibitor SP600125 or vehicle control and then incubated for 8 h without sterol or under cholesterol-loading conditions, also in the absence or presence of SP600125. (D, right) WT or Jnk2−/− macrophages were incubated under control conditions or for 4 or 8 h under cholesterol-loading conditions. Nox2 mRNA was then assayed. (E) Macrophages were pretreated for 1 h with the JNK inhibitor SP600125 (SP) or vehicle control and then incubated for 15 h without sterol, under cholesterol-loading conditions, or with 7-ketocholesterol, also in the absence or presence of SP600125. DCF fluorescence and annexin V staining were then assayed. Bars with the same symbols are not significantly different from each other, whereas bars with different symbols are significantly different from each other. n = 3 for each experimental group. Data are presented as means ± SEM.

