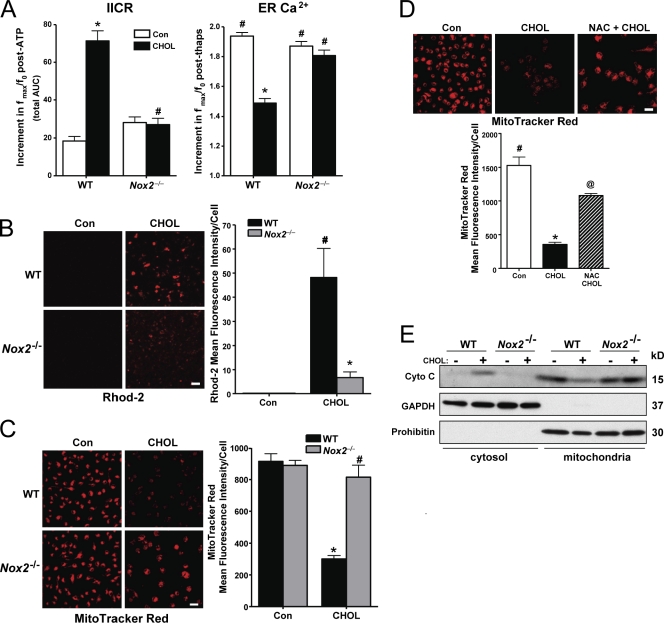
Figure 5.
NOX is necessary for activation of IP3R and the mitochondrial pathway of apoptosis in ER-stressed macrophages. (A, left) Macrophages from WT or Nox2−/− mice were incubated for 6 h under cholesterol-loading conditions (CHOL) and then assayed for IICR, as reflected by the post-ATP increment in the area under curve for ATP-induced calcium release (n = 30 cells). (A, right) To assess ER luminal calcium stores, the cells were treated with 2 µM thapsigargin. The bar graph shows the mean peak amplitude of the postthapsigargin Fluo-3 response. (B) Macrophages from WT or Nox2−/− mice were incubated for 2 h under control (Con) or cholesterol-loading conditions. 10 µM Rhod-2 was then added to the media, and the cells were incubated on ice for 1 h at 4°C. Next, the cells were rinsed to remove extracellular Rhod-2 and incubated for an additional 5 h, also under control or cholesterol-loading conditions. At the end of the incubation period, the cells were visualized using confocal microscopy and imaged as described in Materials and methods. Fluorescence intensity for ∼100 cells was measured for each treatment group. (C) Macrophages from WT or Nox2−/− mice were incubated for 14 h under control or cholesterol-loading conditions and then assayed for MitoTracker red staining as described in Materials and methods. (D) Macrophages were pretreated for 1 h with 0.5 µM NAC, followed by incubation under control or cholesterol-loading conditions for 14 h, also with or without NAC. The cells were then stained with MitoTracker red CMXRos and imaged and quantified as in C. (E) Macrophages from WT or Nox2−/− mice were incubated for 8 h under control or cholesterol-loading conditions. Cytosolic and mitochondrial fractions were assayed for cytochrome c (Cyto C), GAPDH (cytosolic marker), and prohibitin (mitochondrial marker). For all graphs, bars with the same symbols are not significantly different from each other, whereas bars with different symbols are significantly different from each other. n = 3 for each experimental group. Bars, 10 µm. Data are presented as means ± SEM.

