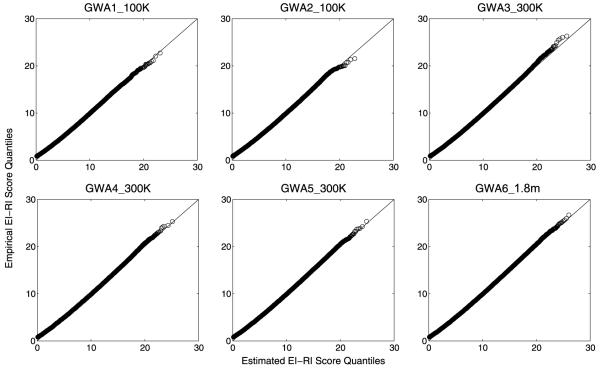
Figure 2b.
Quantile-quantile plots of EI-RI scores for six GWA data sets. Each point corresponds to a probability p: the x-coordinate represents the EI-RI score corresponding to the p-th quantile of the exponential distribution (details in text) and the y-coordinate represents the EI-RI score corresponding to the p-th sample quantile from the empirical data.

