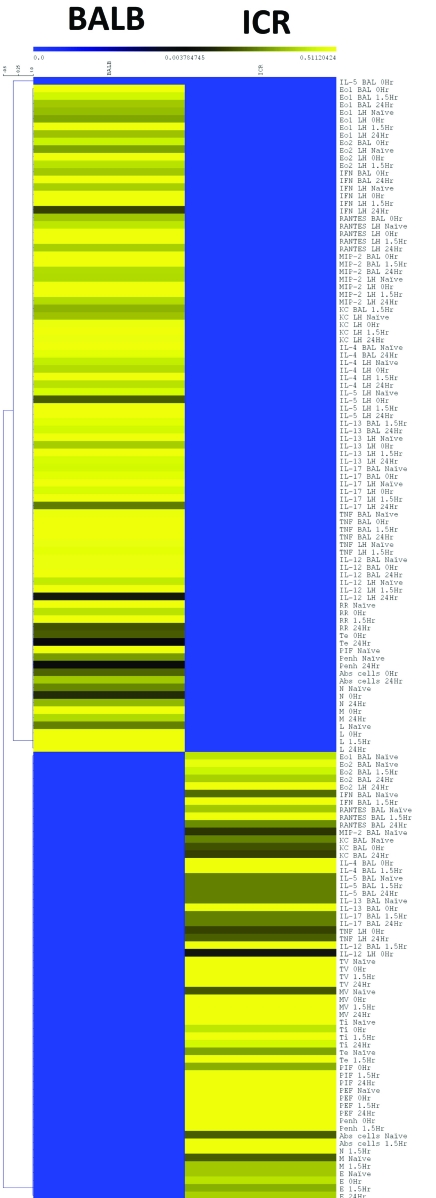
Figure 1.
Heat map of Z-score data parameters including cytokines and chemokines in BAL and lung homogenate; inflammatory cells in BAL and respiratory parameters in response to 50 mg/mL methacholine at 4 time points (naïve, 0 h, 1.5 h, and 24 h). The values for each strain or stock at each of the time points were converted to Z scores (value – average for parameter / SD for parameter) so that they could be displayed on a single heat map without the large values overwhelming the small values. The Z-score data then were averaged for each parameter at each time point for each strain or stock and subjected to hierarchal clustering within data parameters. Clear differences in the inflammatory profile are evident in the heat map, although this figure does not contain any information concerning the intrastrain variability of each group.

