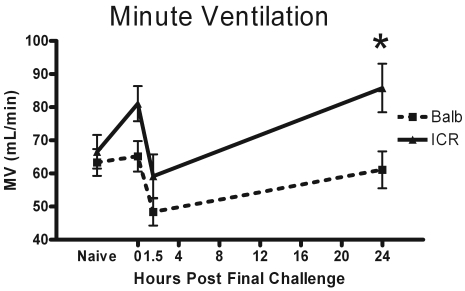
Figure 4.
Minute ventilation (volume of airflow per minute) was measured in naïve mice, in mice just before they would have received their final challenge dose (0 h), and at 1.5 and 24 h after final challenge. The displayed data is the MV change in response to exposure to 50 mg/mL of methacholine since the largest effects were observed at this dose. Data are given as mean ± SEM (n = 4). *, Significant (P < 0.05) between values for BALB and ICR mice.

